How It Works Together
How does the institutional data governance framework function within Western?
It is important to note that data governance is an evolutionary process where internal processes and conceptual thinking will continue to iterate over time. Items that are part of our data glossary, data sharing, and data roles contexts will continue to take shape.
Within any data governance system, there are a number of moving parts. Data interactivity throughout the organization is related to individual roles, functions, and processes and the requirements of the tasks at hand.
Data management exists within a hierarchy, where high-level categories exist at the top and the use-cases exist at the bottom, with increasing detail embedded at level.
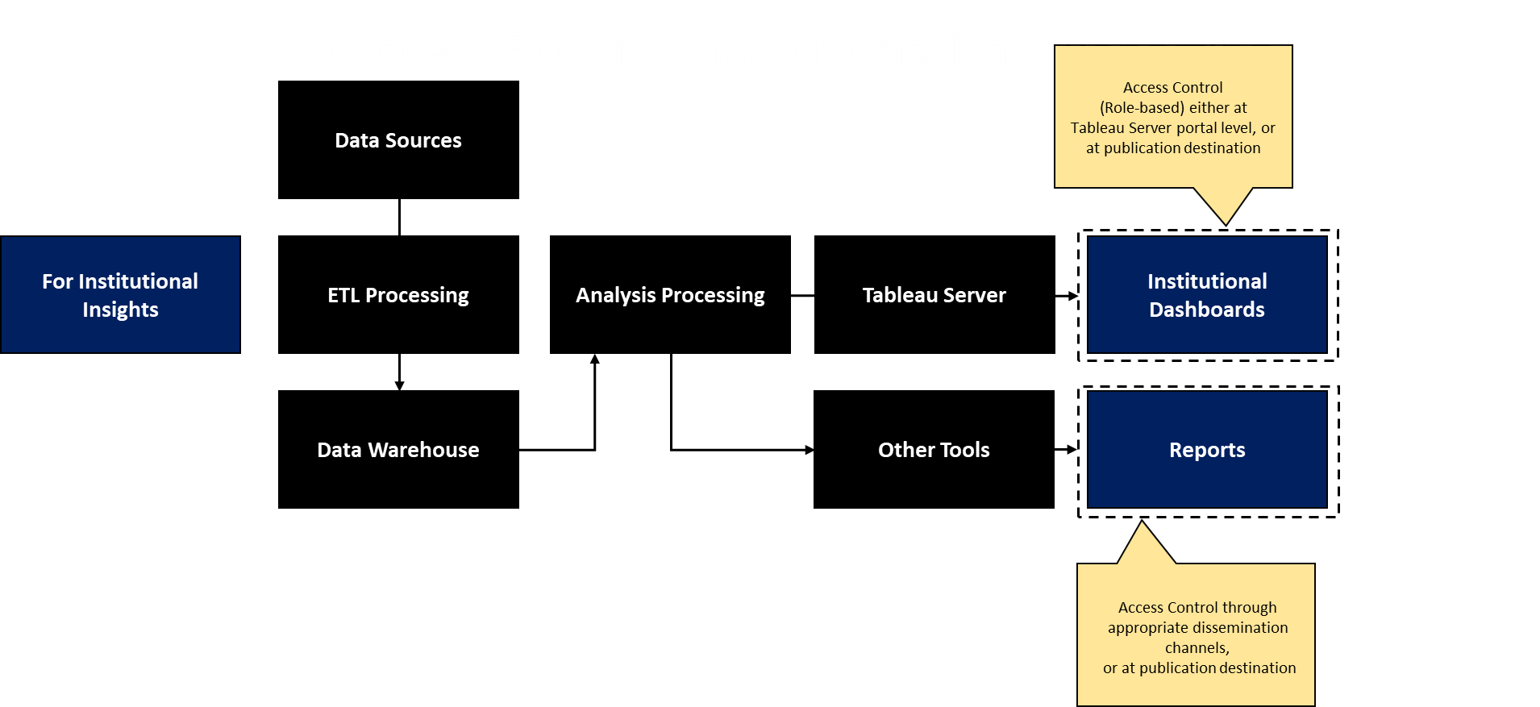
There are basically two sides to Western's data hierarchy: the data categories and the data roles, where there relationships that exist between these columns.
Decision-making and the use of information within these data contexts are related to kind of task or request involved with the process. For example, access to data should involve the Data Domain Leads and the application's Data Stewards related to the data being used to ensure the appropriate sharing of data resources.
The diagram below is a high-level representation of how the data categories and date roles work together and the kinds of escalations that would potentially move up the chain.
Data Governance Workflow:
Data Asset Catalog Management
Our data asset (or application) catalog allows Western to understand the data ecosystem at a detailed level. The catalog will be updated via the data request process and as new projects and implementations are introduced into the environment, TRAC will assist in ensuring those systems are entered into the catalog.
This diagram displays the relationship between a published catalog, data resources, and TRAC.

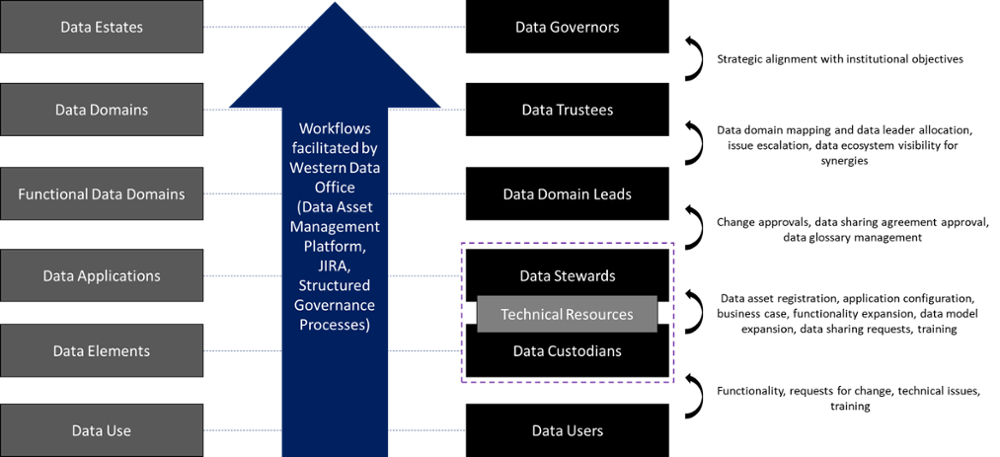
Data Source and Analysis Workflow
One of the trickiest parts of the data governance process is to ensure our data resources are empowered to work with the data required to perform their tasks and within an institutionally responsible manner.
The diagram below repeats the tie-in with TRAC and a data asset catalog but also indicates the processes required to engage in data analysis, either at a unit-level or for the institution.
Data analysis occurs in multiple locations across campus and this model anticipates those use-cases.
Whether a project is unit-level or institutional in orientation, the identification of required data sources is an important step. Next is whether an access request is necessary. Once these items have been ratified, analysis and output are produced, resulting in a need to disseminate the information. This is where the process separates between unit-level and institutional needs.
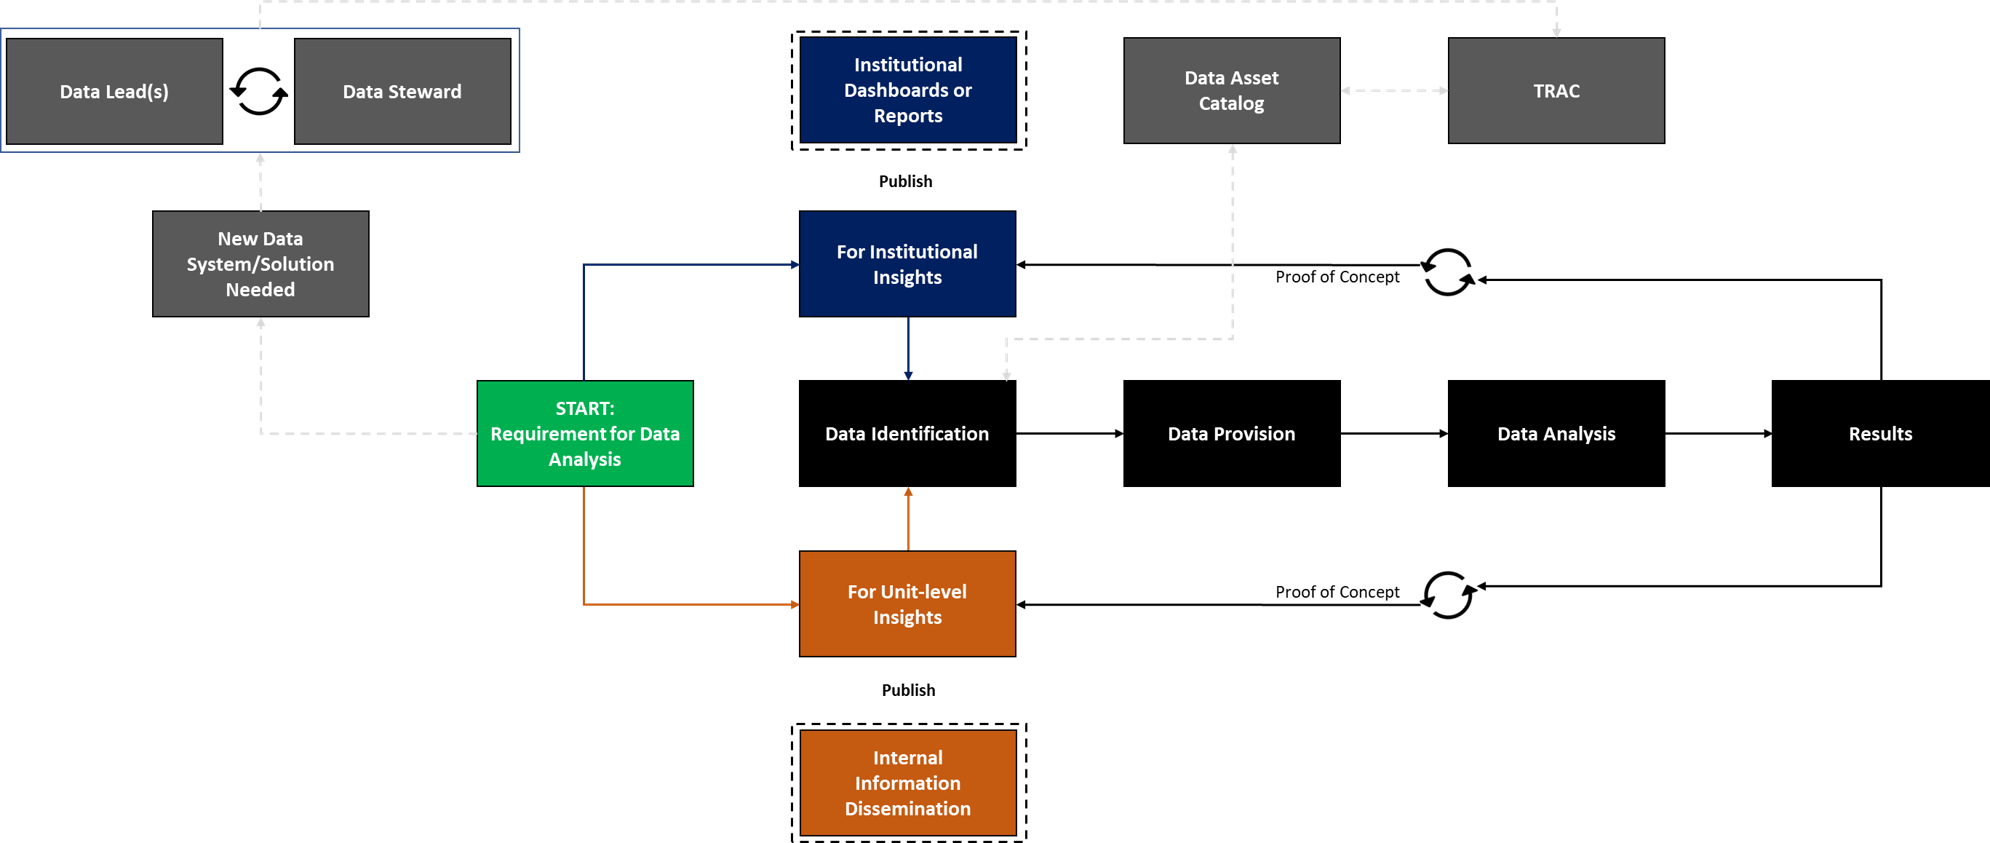
Data Sharing and Provisioning (Request Breakout)
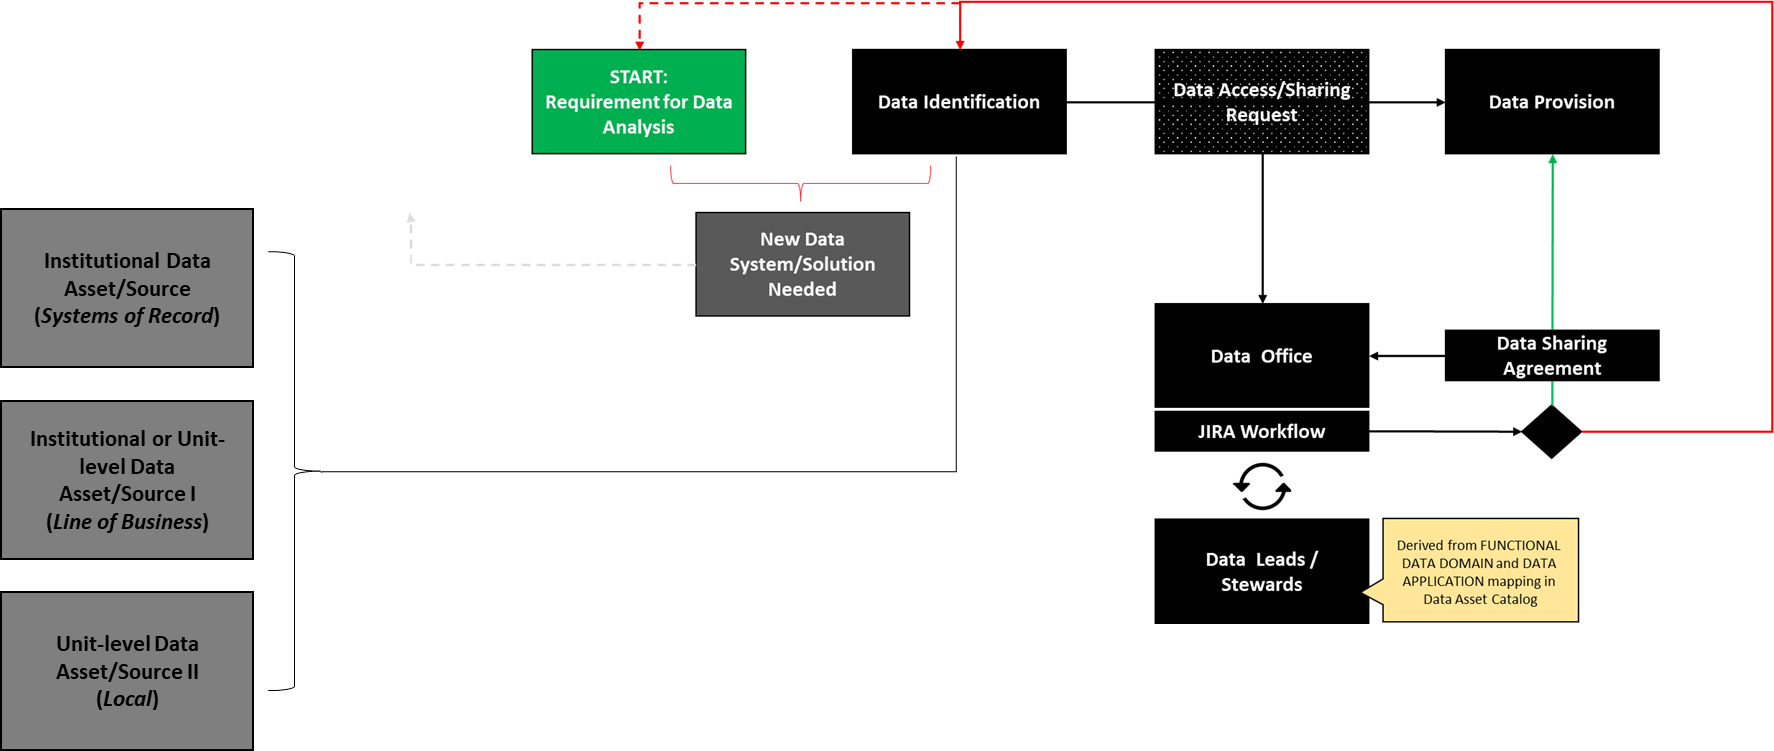
A quick note on data identification and data provisioning. There is a step between these boxes that refers to whether an access request is required for the data. Data identification does not automatically equal access, so a data access process will need to be followed in cases where it is required. The request is initiated through a service request process.
Data Sharing and Provisioning (Detailed)
As seen in the diagram below, if a service request for data access is successful, the requestor will engage in a data sharing arrangement and continue their analysis efforts. If access is not permitted, the request is sent back to the requestor to review the requirement and amend, if necessary, the identified data source. It is possible that a new data source will need to be created if a gap is identified.
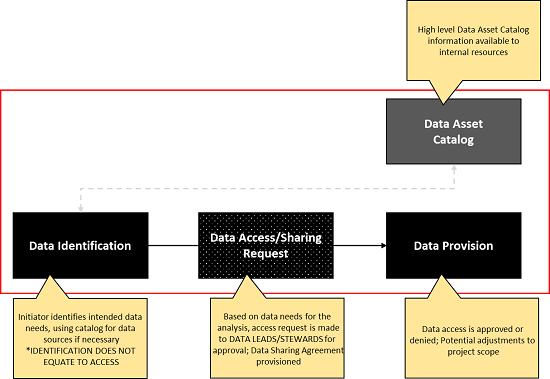
Institutional Data Reporting (Breakout)
Analysis projects will result in some form of output and the question is how will this information now be disemminated to relevant partners. If the output is designed for internal unit-level information sharing, then local processes should be adopted. As reports are identified as institutional in nature (cross-department and used for broad decision-making), the depicted process below is appropriate. In this model, the data sources are clear and positioned within a data warehouse framework, where applicable ETL (extract-transform-load) routines can be performed ahead of analysis. The results of analyses will be ported through Western's Tableau server as a dashboard or located within the context of alternative reporting. 